Logistics Dashboard Design for UAE and Qatar Operators: What Dispatch Teams Actually Need

A logistics dashboard should show what needs action now — delays, failed deliveries, idle drivers — before anything else. Here's the layout, roles and checklist that work, with lessons from designing CargoConnect.
A good logistics operations dashboard shows a dispatcher what needs action right now — delayed shipments, idle drivers, failed deliveries — before it shows anything else. The pattern that works is simple: a few key numbers at the top, a live shipment table in the middle, and a dedicated alerts area so exceptions never get buried. For logistics companies in the UAE and Qatar, where volumes are high and delivery windows are tight, that difference shows up directly in on-time performance.
Here is how to design one that operations teams actually use.
What should a logistics dashboard show first?
| Area | What goes there | Why |
|---|---|---|
| Top metrics | Active deliveries, on-time rate, exceptions, revenue or volume today | A 5-second read of how the day is going |
| Critical alerts | Delays, failed deliveries, vehicles off-route, SLA risks | Urgent issues must never sit below the fold |
| Live shipment table | Status, driver, ETA, customer, last update | The working surface for dispatchers |
| Drivers and fleet | Available, on-route, idle, off-shift | Who can take the next job |
| Performance | Trends by day, route, client or driver | For managers, not for the live shift |
The most common mistake is giving every number the same weight. A dispatcher mid-shift needs exceptions; a manager at month-end needs trends. Design for the person using the screen at that moment.
Who uses the dashboard, and what does each need?
- Dispatchers need speed: see an exception, open it, reassign or contact the driver in one or two clicks.
- Operations managers need the overview: capacity, bottlenecks and on-time rate by route or client.
- Customer service needs lookup: find any shipment fast and see its full history.
- Clients (if you offer a portal) need their own shipments only, with clear status and proof of delivery.
Role-based views keep each screen focused instead of one screen that tries to serve everyone.
What makes an operations dashboard fail?
- Alerts mixed into tables. A red badge on row 43 is an alert nobody sees.
- Too many charts. Charts are for trends. The live shift needs lists and actions.
- No clear status language. "Pending", "processing" and "in progress" meaning slightly different things in different places.
- Slow tables. Operations teams filter and sort all day; a table that lags breaks the workflow.
- Every new module designed from scratch. Warehouse, reports and customers end up looking like different products.
In operations, the dashboard is not a report. It is the tool the team works in all day, and every extra click is paid for in delays.
What we learned designing CargoConnect
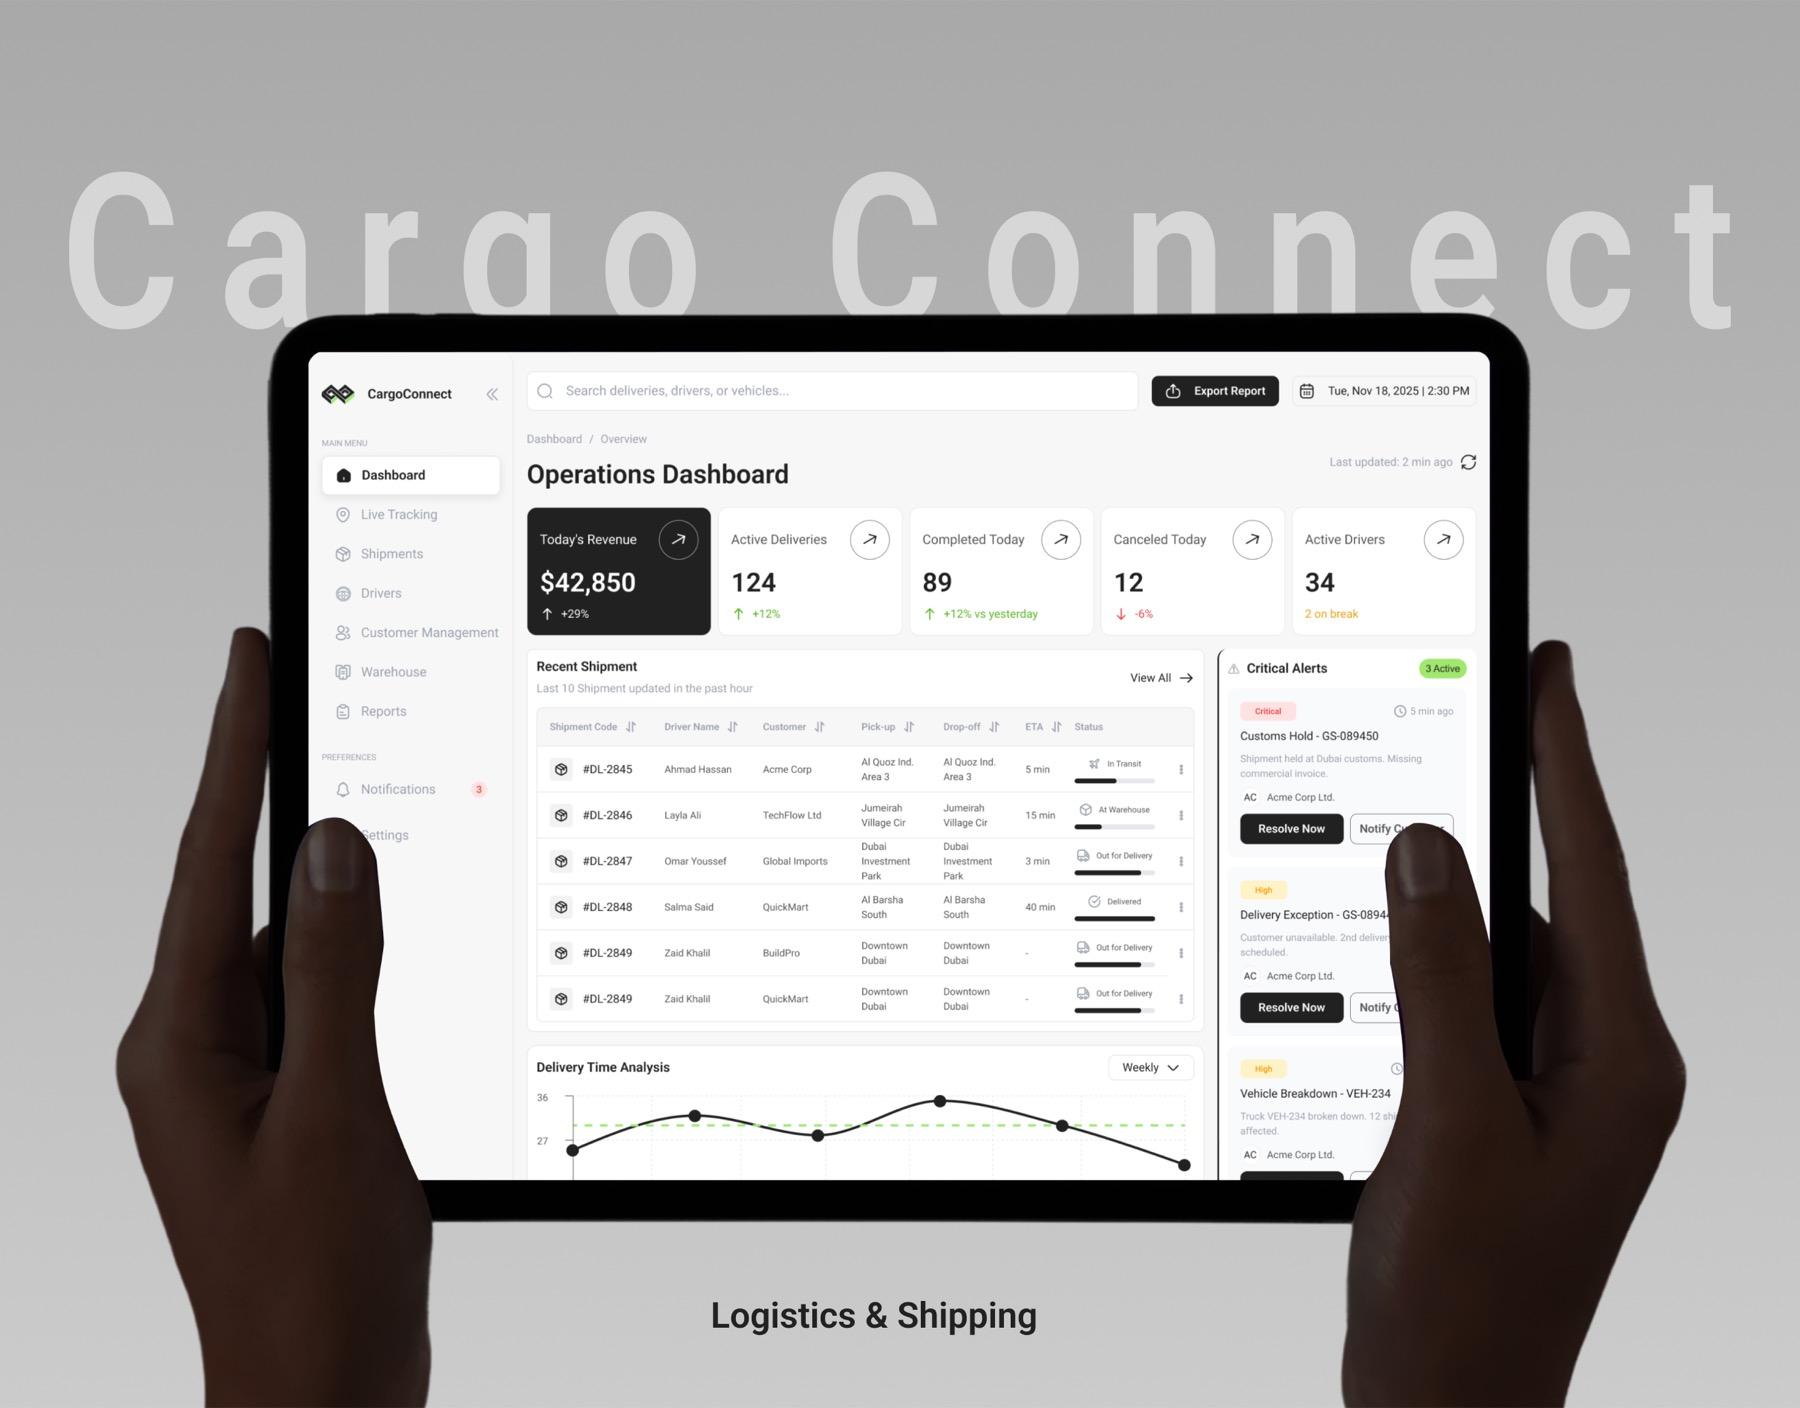
We designed CargoConnect, a logistics and shipping operations platform. The team was juggling dozens of shipments, drivers and exceptions at once, and the old tools buried critical alerts. We built a clear hierarchy — key metrics at the top, a live shipment table, and a dedicated critical-alerts rail — with readable data visualisation and one component system for tables, statuses and actions. That system is what lets new modules such as warehouse, reports and customers be added without the product drifting apart.
A checklist for a logistics dashboard
- Exceptions and SLA risks in their own always-visible area
- Four to six top metrics, not twenty
- One status vocabulary used everywhere
- Fast filtering, sorting and search on the shipment table
- One-click actions: reassign, contact driver, update status
- Role-based views for dispatch, management, support and clients
- A shared component system so new modules stay consistent
- Works on a large ops screen and on a supervisor's tablet
Frequently asked questions
Should we build a custom dashboard or use an off-the-shelf tool?
Off-the-shelf tools are faster to start. A custom dashboard pays off when your workflow is your advantage — specific SLAs, client portals, or integrations with your own systems — and generic tools force your team to work around them.
Can the dashboard connect to our existing systems?
Usually yes. Dashboards are typically fed from your transport management, tracking or warehouse systems through their APIs, so the team works in one place instead of several.
Where do we start if our current system is already in use?
Start with the screen dispatchers use most and redesign that flow first. It shows results quickly and sets the component system for everything after it.
Work with a team that designs and builds
Flowlix is a product design and development studio led by founder Ahmed Bassam, ranked the #1 designer in Egypt on Behance, with 80+ projects shipped — including design work on Hammel, an app with more than 7 million users. One senior team designs and builds, so what is approved in design is what ships. We work with clients in Egypt, Saudi Arabia, the UAE and Qatar. Book a free consultation on WhatsApp to talk through your operations dashboard.